I had a good running year this year setting a new 5k PB (19:27) and a new 100 mile PB (22:27). I also set an unofficial HM PB of 1:29. There running calculators to benchmark the HM/5K time but nothing that I am aware of for the 100 mile PB.
I threw out the question to the Centurion Facebook forum and got back 46 data points for the 3 distances plus a few who also gave their marathon PB.
Caution - the stats are shown as-is. I could do some proper statistical tests on the validity of my conclusions but haven't.
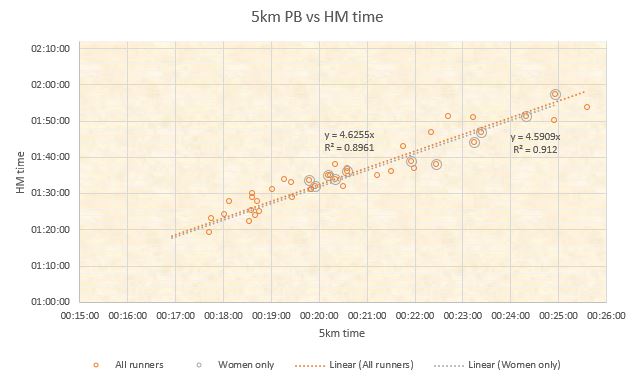
As expected, the 5km and HM times were well correlated. My 19:27 PB for 5k passes almost perfectly through the 1:30 mark for HM.
I had a few data points for the marathon (I hadn't specifically asked for this). My 5K time would suggest a PB of 3:20ish (actually 3:37 but done as a training run). A much lower correlation than 5k/HM and also a bit higher time than implied by the WAVA / Jack Daniels type calculators.
The http://runsmartproject.com/calculator/ suggests my 19:27 time for 5k should give me a 1:29:15 HM (spot on) and 3:06:03 marathon time (not so much).
The Fetcheveryone calculator has me at 3:20 by the way ( https://www.fetcheveryone.com/cms-37 )

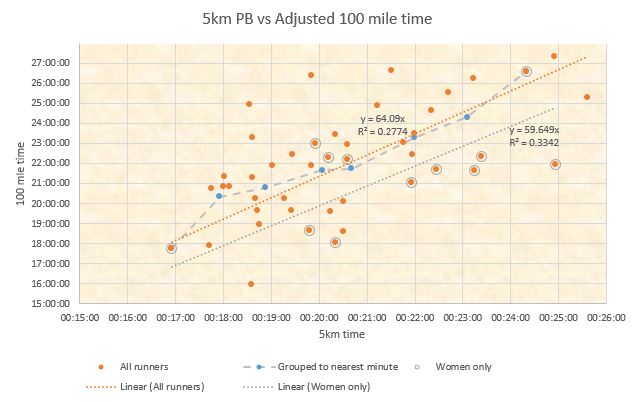
I had a small sample size but the average multiplier is about 66 for men and 60 for women, For women, this has the pleasing result that the 5k time predicts the 100 mile time but in hours. It is the 5k time + 10% for men. But there is an awful lot of variability...
No comments:
Post a Comment